Where this started.
A bad survey result, a question about why people stay, and a machine alarm at 2 a.m.
The beginning of this work was not a formula. It was a question I could not leave alone.
The company where I worked ran a Great Place to Work survey. The results were bad. In a company meeting, the COO responded by asking, “if you don't like it here, then why work here?” I have carried that line with me ever since.
I do not tell this story to attack the person who said it. The line mattered because it turned my attention toward a larger problem. The survey had produced a result. The result pointed to something that was not working. Then the focus shifted to the employees who were still there.
That raised the question for me. Why do people stay?
The first word that came to mind was gravity.
Gravity holds something in place. It can keep people tied to a situation even when they would rather leave. Staying does not always mean agreement. It does not always mean satisfaction. It does not always mean that the system is working. Sometimes staying only means that other forces are stronger than the desire to go.
That answer gave me a way to think about the problem, but not yet a way to draw it. My first attempt was Newton's prism. A prism gave me a way to picture linear drift, a line entering, changing direction, and leaving at another angle.
But a company does not move along one clean line. Companies have multiple angles and multiple forces acting at the same time. The prism was a start. It was not enough.
The next part came at work, around 2 a.m. I was running a CNC machine when it threw an alarm: “table misalignment disagreement.” The words that stayed with me were rotation, angle, gravity, and pressure.
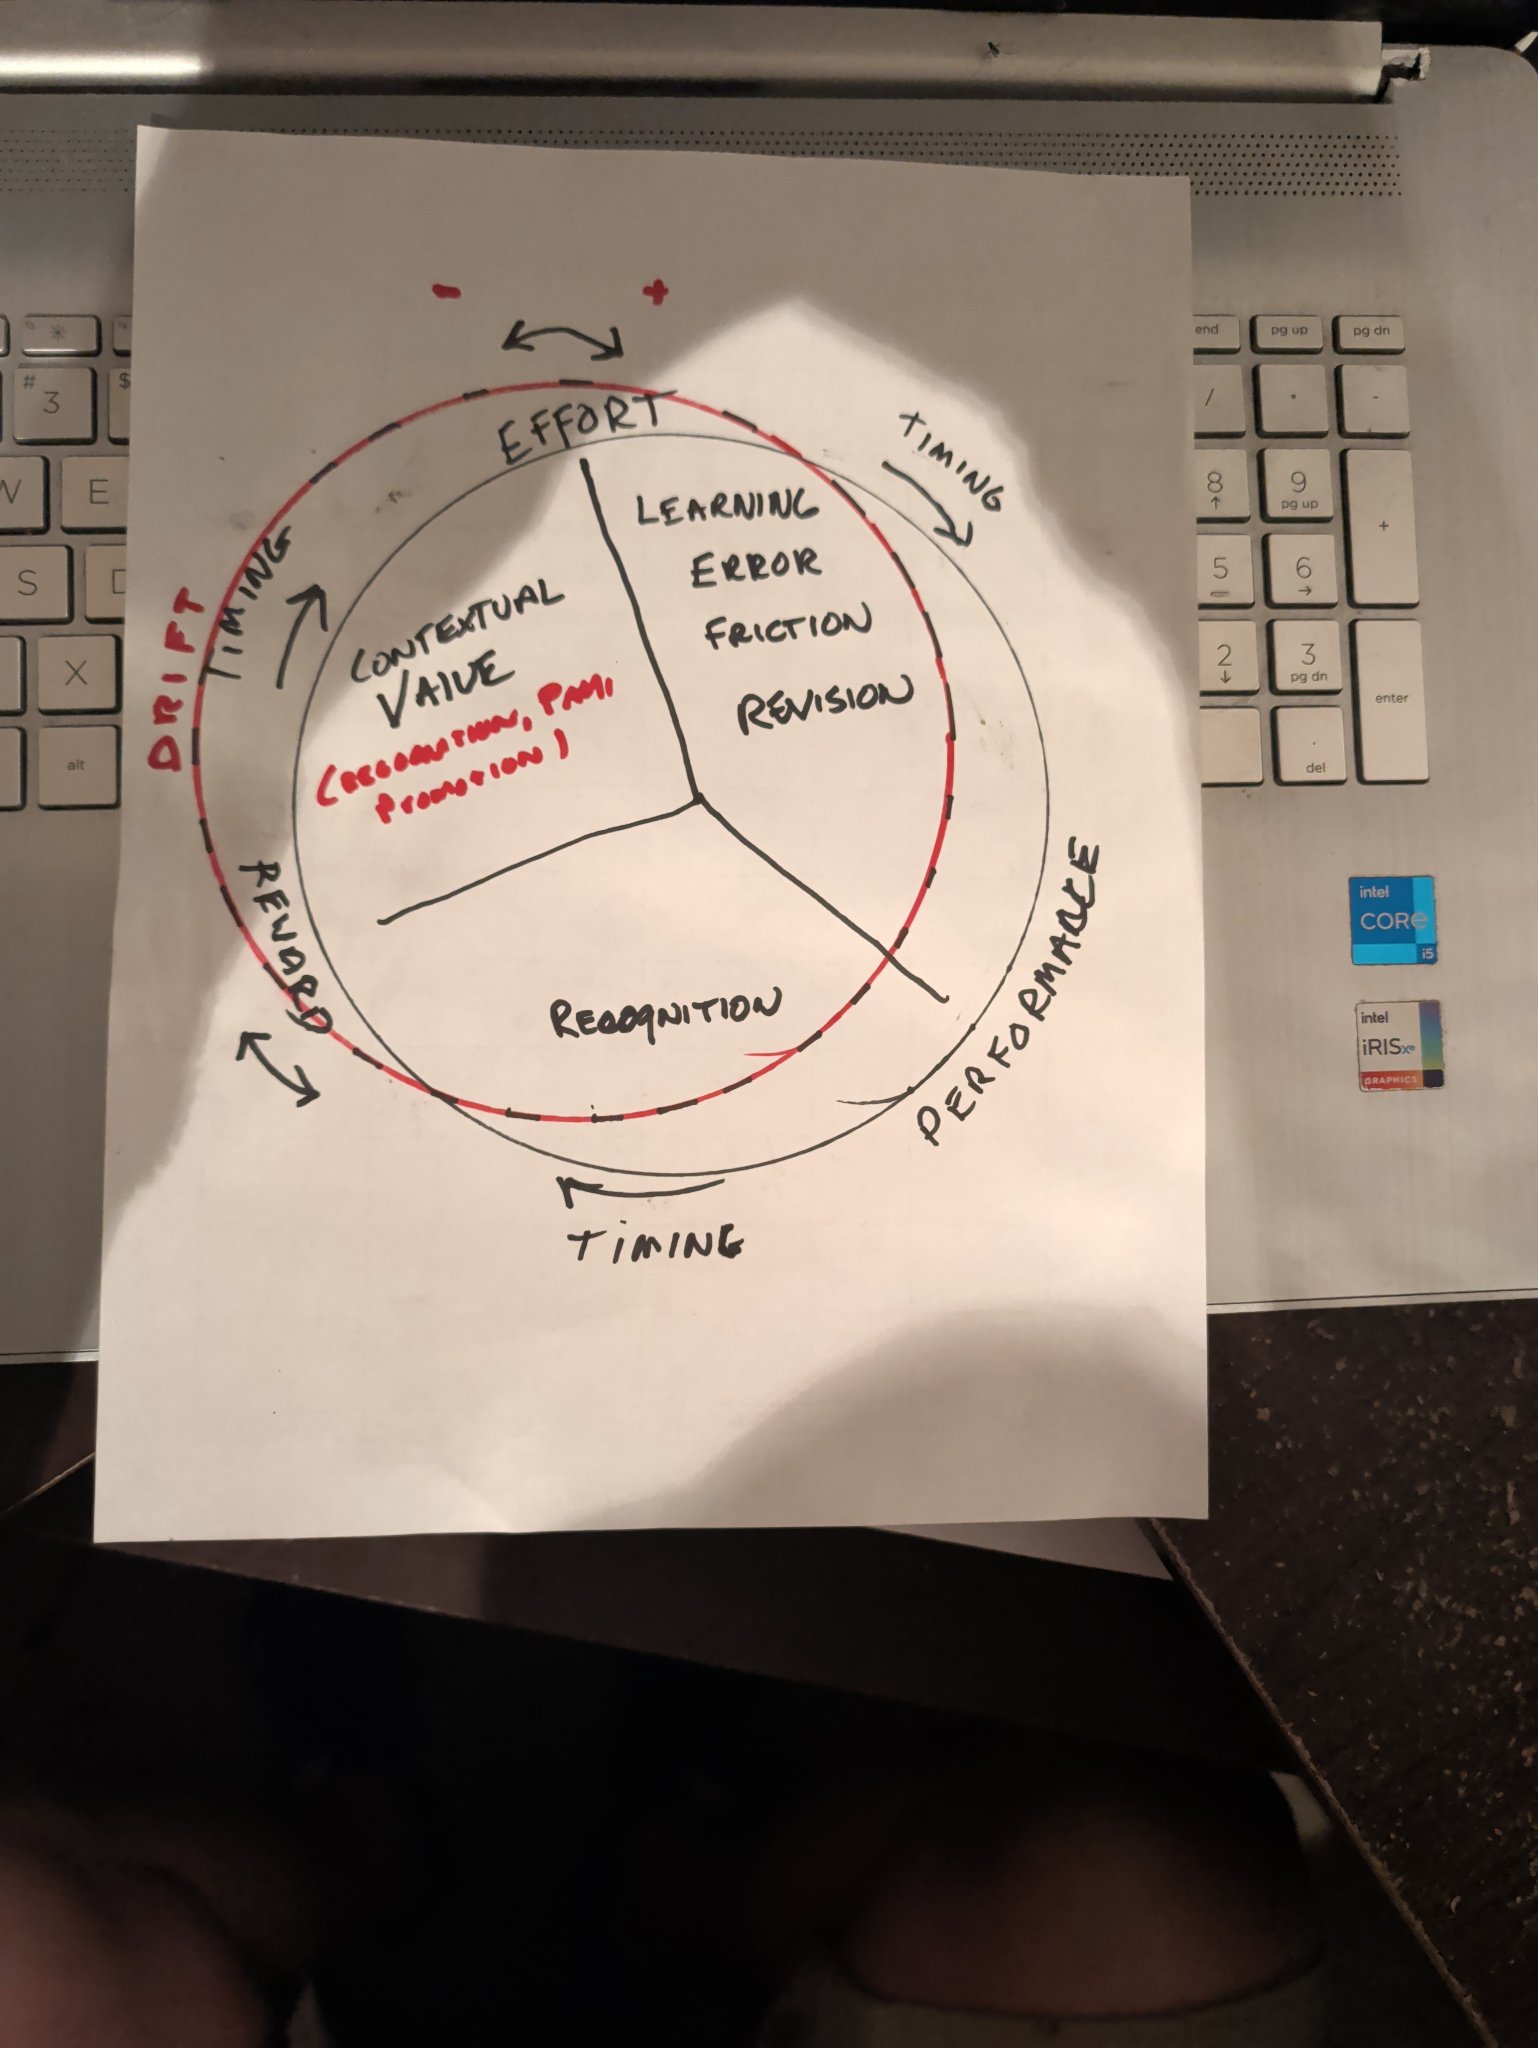
That same night, I drew the model by hand on a sheet of paper. I drew a circle. I put EFFORT at the top. I drew TIMING arrows around the perimeter. I wrote DRIFT in red. I divided the circle into sections labeled CONTEXTUAL VALUE, LEARNING-ERROR-FRICTION-REVISION, and RECOGNITION. I added REWARD and PERFORMANCE.
It was a rough drawing. But the page held what the prism could not. It let me put several angles and forces in one place instead of forcing the whole problem into a straight line.
Two years later, that sketch became the framework this site is built on.